Abstract
Liver zonation is a fundamental characteristic of hepatocyte spatial heterogeneity, which is challenging to recapitulate in traditional cell cultures. This study presents a novel microfluidic device designed to induce zonation in liver cell cultures by establishing an oxygen gradient using standard laboratory gases. The device consists of two layers; a bottom layer containing a gas channel network that delivers high (cell incubator air, 19% oxygen) and low oxygenated (nitrogen) gases to create three distinct zones within the cell culture chamber in the layer above. Computational simulations and ratiometric oxygen sensing were employed to validate the oxygen gradient, demonstrating that stable oxygen levels were achieved within two hours. Liver zonation was confirmed using immunofluorescence staining, which showed zonated albumin production in HepG2 cells directly correlating with oxygen levels and mimicking in-vivo zonation behavior. This user-friendly device supports studies on liver zonation and related metabolic disease mechanisms in vitro. It can also be utilized for experiments that necessitate precise gas concentration gradients, such as hypoxia-related research areas focused on angiogenesis and cancer development.
1 Introduction
The liver is composed of a set of highly dedicated cell types which organize into functional units known as liver lobules. The cells in the liver lobules specialize in essential tasks such as detoxification, bile production, protein synthesis, glucose regulation, and vitamin storage (Arias et al. 2020). Each liver lobule has six subunits (acinuses) where blood capillaries called sinusoids, are arranged radially and culminates at the central vein (Juza & Pauli, 2014), as depicted in Fig. 1. At the periportal end of the liver lobule, the hepatic artery and portal vein converge to supply the cells with blood rich in oxygen and nutrients. As these resources are consumed by the cells, concentration gradients will form along the sinusoids, with the highest concentration near the periportal end and the lowest near the central vein at the pericentral end. Consequently, cells encounter varying concentrations of nutrients, oxygen, and waste products based on their location, driving the phenomena of metabolic zonation within the liver lobule (Tomlinson et al. 2019). Metabolic zonation is a critical physiological feature that allows liver cells to exhibit diverse activities and characteristics depending on their position along the sinusoidal space. This zonation is often overlooked in conventional cell cultures, raising concerns about the accuracy of in-vitro models (Scheidecker et al. 2020).
Figure 1.
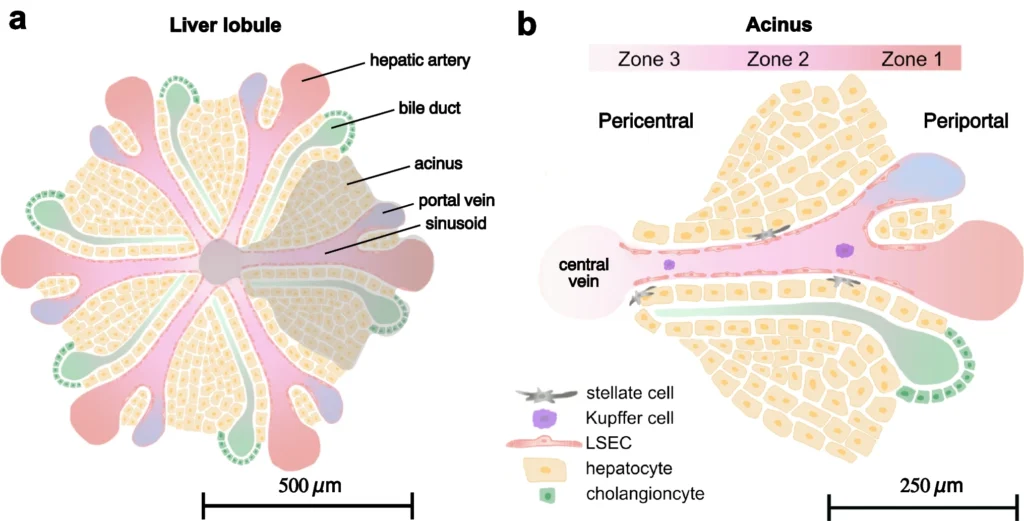
Schematic of the liver lobule and the influence of sinusoidal structure on hepatic zonation. (a) The liver lobule consists of hexagonal structures housing predominantly hepatocytes. The blood is supplied by the periportal vein and hepatic artery, providing nutrient and oxygen-rich blood respectively, which converge into the liver sinusoids. (b) The acinus is structured into three zones based on the hepatic function and metabolic activity. Endothelial cells (LSECs) line the vascular wall, shielding hepatocytes from shear stress while allowing constituents from the blood to diffuse into the tissue. As blood moves from the periportal side of the sinusoid toward the central vein, cellular consumption creates gradients of nutrients and oxygen along the sinusoid. These gradients are crucial in driving hepatic zonation, where hepatocytes display distinct functional behaviors depending on their location within the liver lobule. Additionally, other cell types such as stellate cells and liver-specific macrophages, known as Kupffer cells, each fulfill specific roles in both healthy and diseased liver tissue
The emergence of microfluidic technology has spurred efforts to develop in-vitro liver models that replicate the intricate microstructural liver functions found in-vivo (Leung et al. 2022). Microfluidics offers advantages such as precise spatiotemporal control over cell cultures by adjusting parameters like shear stress and availability of oxygen and nutrients, enabling cells to experience physiologically relevant environmental conditions (Rashidi et al. 2016; Vinci et al. 2011). Hence, in-vitro cultures in a microfluidic setting hold significant promise as tools for assessing drug efficacy and toxicity, effectively bridging the gap between preclinical and clinical testing (Materne et al. 2013; Zhang et al. 2018).
Incorporating zonation into an in-vitro liver model allows for the examination of specific niches in the context of disease or metabolic disruptions. For instance, metabolic dysfunction-associated steatotic liver disease (MASLD) predominantly affects hepatocytes in the pericentral zone, where the fatty acid beta-oxidation takes place (Brunt 2010). Conversely, hepatitis resulting from a yellow fever viral infection selectively spares hepatocytes around the periportal zone (Quaresma et al. 2006). Therefore, liver models with zonation features facilitate the investigation of liver diseases within the specific zone at the very location in which they are manifested. Additionally, these models allow for the exploration of inter-zonal communication between cells, providing insights into the mechanisms underlying liver diseases and metabolic disorders (Bale et al. 2014).
Different biomolecules display gradients within the liver acinus, where the concentration of dissolved oxygen plays a critical role in inducing zonation through β-catenin signaling (Kietzmann 2017; Tomlinson et al. 2019). In laboratory settings, scientists employ microfluidic liver-on-a-chip platforms to establish oxygen concentration gradients in cell cultures. Various methods, such as passive induction, the use of chemical oxygen scavengers, and the introduction of gaseous oxygen, are employed to generate gas gradients in these devices (Ghafoory et al. 2022; Kang et al. 2020; Kang et al. 2018). However, each method comes with its own inherent limitations. When employing passive induction, the generated gradient of nutrients and oxygen in the cell culture medium is solely driven by cellular metabolism, reflecting the natural zonation principles observed in liver-on-a-chip studies (Domansky et al. 2010; Lee-Montiel et al. 2017; Li et al. 2018). Nevertheless, the sensitivity of oxygen concentration to changes in flow rate poses challenges to controlling the microenvironment, and fluctuating cellular metabolism contributes to the issue. Adjusting the flow rate to modify the gradient may expose cells to varying shear stresses, potentially eliciting unwanted or detrimental cellular responses. Thus, the range of flow rate adjustments is limited and depends on cell type and microfluidic channel dimensions. Another approach to modulate the dissolved oxygen concentration in a microfluidic chip could be achieved by adding chemical oxygen scavengers such as sodium sulfate, cobalt nitrate, or deferoxamine (DFX) to the cell culture medium (Ghafoory et al. 2022; Kang et al. 2020; Kang et al. 2018). One major limitation with this approach is that scavengers alter the electrolyte balance of the cell culture medium and can adversely affect cells (Han et al. 2020). A more cell friendly option is to introduce gaseous oxygen through a permeable substrate like a polydimethylsiloxane (PDMS) membrane (Tonon et al. 2019; Tornberg et al. 2022). Typically, this non-invasive method necessitates access to gas facilities and large containers of costly oxygen mixtures, which are commonly available only in highly specialized mammalian cell culture laboratories.
In this study, we present a novel and user-friendly microfluidic device designed for 2D liver zonation-on-a-chip (ZoC) applications. Our ZoC device mimics liver zonation by incorporating an oxygen gradient and a parallel nutrient gradient, both aligned in the direction of the flow of cell culture medium. The oxygen concentration gradient in the ZoC cell culture chamber is formed utilizing an intricate microfluidic gas network where the gaseous oxygen is transferred to the cell culture chamber above through a PDMS membrane. This setup creates three distinct oxygen tension zones within the chamber, closely mimicking the in vivo environment. Concurrently, cells in these zones receive cell culture medium sequentially, replicating also the nutrient gradient observed in vivo within the acinus. To regulate the oxygen levels in the ZoC culture chamber, we utilize ambient incubator air and pure nitrogen as gas sources, both of which are readily accessible in standard laboratories. This approach not only allows for precise control of oxygen tension but also simplifies operational procedures for users. The microfluidic design, along with the distribution of glucose, oxygen, and shear stress, was simulated using COMSOL Multiphysics, both with and without cells in the ZoC device culture chamber. Experimental measurements using luminescence-based ratiometric oxygen sensors verified the oxygen tension levels. Finally, the viability of HepG2 cells was confirmed using the device, evaluating functionality based on spatially zonated albumin expression.
2 Materials and methods
2.1 Device design and fabrication
The device is fabricated in polydimethylsiloxane (PDMS) and comprises a dual-layer system designed to accommodate a 2D layer of perfused cells subjected to different oxygen levels. The lower layer (gas channel network) is approximately 2 mm thick, contains two non-intersecting gas channels measuring 0.2 mm in width and 0.1 mm in height. The upper layer (cell chamber) has a thickness of approximately 3 mm. Together, these layers contribute to an overall device thickness of about 5 mm bonded to a cover slide (see Fig. 2).
Figure 2.

The computer-assisted design (CAD) of the chip layers and detailed gas channel network. a The split view, which consists of the upper cell chamber layer hosting the cells featuring an inlet (the solid black arrow) and an outlet (the dotted black arrow), a gas channel network layer of serpentine gas channels in the middle (the inlets for high-oxygen gas and low-oxygen gas are shown in blue and red arrows, respectively), and a glass slide at the very bottom. b The top view of the device, displaying the overlap of the gas and cell layers. It illustrates the positions of the gas channel inlet and outlets, demonstrating how these channels establish three distinct oxygenation zones within the cell chamber: high (zone 1, corresponding to the periportal zone), medium (zone 2) and low (zone 3, corresponding to the pericentral zone)
The gas channel network is supplied with two different gases: a high oxygenated gas (cell incubator air, 19% oxygen) and pure nitrogen gas (0% oxygen). This lower layer is plasma bonded facing the cover slide, leaving the gas to permeate through the PDMS material to reach the cells (see Fig. 2a). To achieve zonation, a suction is applied at one outlet with a vacuum pump (104 SA-VD (AC) Vibrating Diaphragm Pump, Schwarzer Precision) to guide the ambient air from the cell incubator into the chip at a flow rate of 2–3 mL/min, while nitrogen is introduced into the gas channel at the opposite side at an equal flow rate (see Fig. 2b). The design of the gas channel network has been carefully engineered to generate three distinct oxygen levels within the cell culture chamber, mirroring the in-vivo environment.
Initially, the cell chamber design and the corresponding photomask for the gas channel network pattern was generated using Corel DRAW. The gas layer was fabricated in two steps using soft lithography according to the methodology by Banaeiyan et al. (Banaeiyan et al. 2017). In short, a layer of the anti-photoresist SU-8 3050 was spin-coated for 30 s at 1000 rpm onto a silicon wafer, leaving a layer of 100 μm thickness of SU-8. The photomask was then placed on top the SU-8 coated wafer and the entire wafer was exposed to UV radiation for one minute (MA200 mask aligner, SUSS Microtech). The wafer was then developed using a developer solution (Micro Resist Technology GmbH), to remove the unexposed anti-photoresist, thereby revealing the patterned mold.
To create the cell chamber mold, a 1 mm sheet of poly(methyl methacrylate) (PMMA) was laser-cut based on the computer-assisted design (CAD) software design. The resulting structure was affixed to a flat glass surface using commercially available adhesive super glue (Henkel, Düsseldorf, Germany).
For the soft lithography procedure, a mixture of PDMS (Sylgard 184, Dow Corning, Midland, Michigan, US) and its corresponding crosslinker was prepared in a 10:1 (w/w) ratio. It is important to maintain the total height of the gas channel network within 2 mm ± 0.3 mm to ensure that the resulting oxygen gradient matches the simulation and remains consistent across experiments. After degassing, this mixture was poured onto both the cell and gas layer molds, and was left to incubate at 60°C overnight for crosslinking. After carefully removing resulting crosslinked PDMS from the molds, inlet and outlet holes were created using a 1.5 mm puncher (33-31AA-P/25, Miltex, Integra LifeSciences, Princeton, New Jersey, US). The two layers were precisely aligned and bonded together via air plasma treatment (18 W, 30 s; PDC-32G-2, Harrick Plasma, Ithaca, New York, US), followed by incubation at 60°C for 30 min. Subsequently, the device was plasma bonded onto a plain soda-lime glass slide (76 × 26 × 1 mm from Paul Marienfeld GmbH & Co. KG, Lauda-Königshofen, Germany) and incubated overnight at 60˚C before use. A schematic of the device fabrication is illustrated in Fig. 3.
Figure 3.
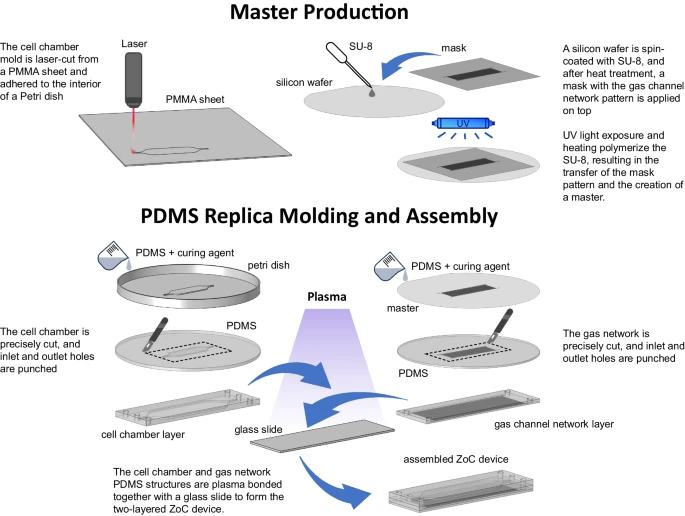
Fabrication process of the ZoC device with a gas channel network and cell chamber using soft lithography and laser cutting. A PMMA sheet was laser-cut to form the cell chamber mold meanwhile the mold for the gas channel network was fabricated using soft lithography. Here, an SU-8 anti-photoresist was spin-coated onto a silicon wafer and patterned via UV exposure to outline the gas channel network. Both molds were then used for polydimethylsiloxane (PDMS) replica molding and crosslinked with heat. Finally, the gas channel network and cell chamber layers were bonded together and attached to a glass slide, completing the assembly of the ZoC device
2.2 Numerical analysis
The numerical analysis was performed in COMSOL Multiphysics 6.0 finite element software (Burlington, MA, US) as a three-dimensional domain. The simulation model incorporated a coupled analysis of computational fluid dynamics (CFD) within the culture chamber and simultaneous glucose and oxygen mass transfers. While fluid flow and glucose distribution were confined to the culture chamber, the analysis of oxygen involved the entire device, including the PDMS bulk and gas network.
The flow simulation assumed Newtonian incompressible laminar flow with a flow rate of 0.5 µL/min and no-slip boundary conditions at the channel walls. The outlet pressure of the device was set to atmospheric pressure. Density and dynamic viscosity values were assigned as 1.009 g/cm3 and 0.93 mPas, respectively, based on the properties of the DMEM culture media supplemented with 10% FBS at 37°C (Poon, 2020).
The fluidic behavior of the flow in the laminar regime was simulated under the assumptions of constant fluid density and viscosity throughout the culture chamber, and it coupled the mass conservation and Navier–Stokes as the governing equations:
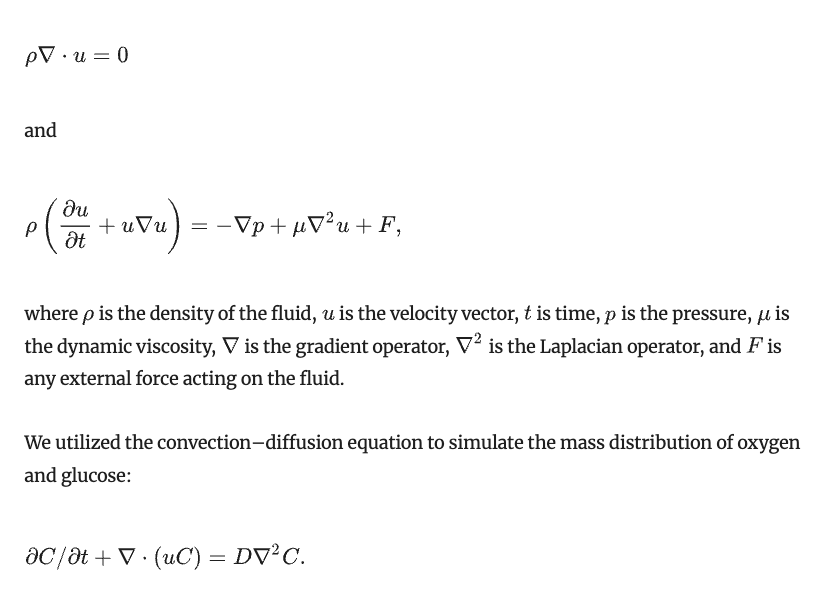
Here, C is the concentration of the species being transported, t is time, u is the fluid velocity, and D is the diffusion coefficient set to 6.16 × 10⁻¹⁰ m2/s and 2.69 × 10⁻⁹ m2/s, for glucose and oxygen in the cell culture medium at 37°C, respectively (Bavli et al. 2016; Place et al. 2017).
For modeling the oxygen distribution, the oxygen diffusion coefficient in PDMS was set to 3.25 × 10⁻⁹ m2/s (Markov, Lillie, Garbett, & McCawley, 2014), with saturated oxygen concentration applied at the boundaries exposed to the atmosphere, measuring 1.8 mol/m3. The interface between the cell culture medium and PDMS was characterized using a partition coefficient of 10…
References
-
A. Al-Ani, Toms, D., Kondro, D., Thundathil, J., Yu, Y., & Ungrin, M. PLoS One. (2018) https://doi.org/10.1371/journal.pone.0204269
-
I. M. Arias, Alter, H. J., Boyer, J. L., Cohen, D. E., Shafritz, D. A., Thorgeirsson, S. S., et al. The liver: biology and pathobiology (Sixth ed.): John Wiley & Sons. (2020)
-
S. S. Bale, Vernetti, L., Senutovitch, N., Jindal, R., Hegde, M., Gough, A., et al. Exp. Biol. Med. (2014) https://doi.org/10.1177/1535370214531872
-
A. A. Banaeiyan, Theobald, J., Paukštyte, J., Wölfl, S., Adiels, C. B., & Goksör, M. Biofabrication. (2017) https://doi.org/10.1088/1758-5090/9/1/015014
-
D. Bavli, Prill, S., Ezra, E., Levy, G., Cohen, M., Vinken, M., et al. Proc. Natl. Acad. Sci. (2016) https://doi.org/10.1073/pnas.1522556113
-
E. M. Brunt, Nat. Rev. Gastroenterol. Hepatol. (2010). https://doi.org/10.1038/nrgastro.2010.21
-
P. Buchwald, Theor. Biol. Med. Model. (2009). https://doi.org/10.1186/1742-4682-6-5
-
J. Butler, Lü, E., Navarro, P., & Christiansen, B. J. Mol. Recogn. Interdiscip. J (1997) https://doi.org/10.1002/(SICI)1099-1352(199701/02)10:1%3C36::AID-JMR353%3E3.0.CO;2-G
-
H. J. Chen, Miller, P., & Shuler, M. L. Lab on a Chip. (2018) https://doi.org/10.1039/C8LC00111A
-
J. N. Demas, DeGraff, B., & Xu, W. Anal. Chem. (1995) https://doi.org/10.1021/ac00104a012
-
K. Domansky, Inman, W., Serdy, J., Dash, A., Lim, M. H., & Griffith, L. G. Lab on a Chip. (2010) https://doi.org/10.1039/B913221J
-
K. Du, Li, S., Li, C., Li, P., Miao, C., Luo, T., et al. Acta Biomater. (2021) https://doi.org/10.1016/j.actbio.2021.07.013
-
D. S. Edgerton, Lautz, M., Scott, M., Everett, C. A., Stettler, K. M., Neal, D. W., et al. J. Clin. Invest. (2006) https://doi.org/10.1172/JCI27073
-
M. B. Esch, Mahler, G. J., Stokol, T., & Shuler, M. L. Lab on a Chip. (2014) https://doi.org/10.1039/C4LC00371C
-
S. Ghafoory, Stengl, C., Kopany, S., Mayadag, M., Mechtel, N., Murphy, B., et al. Cells. (2022) https://doi.org/10.3390/cells11233734
-
X. Han, Zhu, F., Chen, L., Wu, H., Wang, T., & Chen, K. Mol. Cell. Biochem. (2020) https://doi.org/10.1007/s11010-020-03805-8
-
R. M. Juza, & Pauli, E. M. Clin. Anat. (2014). https://doi.org/10.1002/ca.22350
-
Y. B. Kang, Eo, J., Bulutoglu, B., Yarmush, M. L., & Usta, O. B. Biotechnol. Bioeng. (2020) https://doi.org/10.1002/bit.27225
-
Y. B. A. Kang, Eo, J., Mert, S., Yarmush, M. L., & Usta, O. B. Sci. Rep. (2018) https://doi.org/10.1038/s41598-018-27179-6
-
T. Kietzmann, Int. J. Mol. Sci. (2019). https://doi.org/10.3390/ijms20092347
-
T. Kietzmann, Redox Biol. (2017). https://doi.org/10.1016/j.redox.2017.01.012
-
F. T. Lee-Montiel, George, S. M., Gough, A. H., Sharma, A. D., Wu, J., DeBiasio, R., et al. Exp Biol Med. (2017) https://doi.org/10.1177/1535370217703978
-
C. M. Leung, De Haan, P., Ronaldson-Bouchard, K., Kim, G.-A., Ko, J., Rho, H. S., et al. Nat. Rev. Meth. Prim. (2022) https://doi.org/10.1038/s43586-022-00118-6
-
X. Li, George, S. M., Vernetti, L., Gough, A. H., & Taylor, D. L. Lab on a Chip. (2018) https://doi.org/10.1039/C8LC00418H
-
R. Mahdavi, Hashemi-Najafabadi, S., Ghiass, M. A., & Adiels, C. B. Med. Biol. Eng. Comput. (2024) https://doi.org/10.1007/s11517-023-02936-6
-
D. A. Markov, Lillie, E. M., Garbett, S. P., & McCawley, L. J. Biomed. Microdev. (2014) https://doi.org/10.1007/s10544-013-9808-2
-
E.-M. Materne, Tonevitsky, A. G., & Marx, U. Lab on a Chip. (2013) https://doi.org/10.1039/C3LC50240F
-
T. L. Place, Domann, F. E., & Case, A. J. Free Rad. Biol. Med. (2017) https://doi.org/10.1016/j.freeradbiomed.2017.10.003
-
C. Poon. bioRxiv. (2020) https://doi.org/10.1016/j.jmbbm.2021.105024
-
J. A. Quaresma, Barros, V. L., Pagliari, C., Fernandes, E. R., Guedes, F., Takakura, C. F., et al. Virology. (2006) https://doi.org/10.1016/j.virol.2005.09.058
-
M. Rafat, Raad, D. R., Rowat, A. C., & Auguste, D. T. Lab on a Chip. (2009) https://doi.org/10.1039/B907957B
-
H. Rashidi, Alhaque, S., Szkolnicka, D., Flint, O., & Hay, D. C. Arch. Toxicol. (2016) https://doi.org/10.1007/s00204-016-1689-8
-
B. Scheidecker, Shinohara, M., Sugimoto, M., Danoy, M., Nishikawa, M., & Sakai, Y. Front. Bioeng. Biotechnol. (2020) https://doi.org/10.3389/fbioe.2020.00524
-
T. W. Secomb, Annu. Rev. Fluid Mech. (2017). https://doi.org/10.1146/annurev-fluid-010816-060302
-
H. Shiku, Saito, T., Wu, C.-C., Yasukawa, T., Yokoo, M., Abe, H., et al. Chem Lett. (2006) https://doi.org/10.1246/cl.2006.234
-
Y. Tanaka, Yamato, M., Okano, T., Kitamori, T., & Sato, K. Meas. Sci. Technol. (2006) https://doi.org/10.1088/0957-0233/17/12/S08
-
A. W. Tilles, Baskaran, H., Roy, P., Yarmush, M. L., & Toner, M. Biotechnol. Bioeng. (2001) https://doi.org/10.1002/bit.1071
-
M.W. Toepke, & Beebe, D. J. Lab Chip (2006). https://doi.org/10.1039/B612140C
-
L. Tomlinson, Hyndman, L., Firman, J. W., Bentley, R., Kyffin, J. A., Webb, S. D., et al. Front. Bioeng. Biotechnol. (2019) https://doi.org/10.3389/fbioe.2019.00017
-
F. Tonon, Giobbe, G. G., Zambon, A., Luni, C., Gagliano, O., Floreani, A., et al. Sci Rep. (2019) https://doi.org/10.1038/s41598-019-49412-6
-
K. Tornberg, Välimäki, H., Valaskivi, S., Mäki, A.-J., Jokinen, M., Kreutzer, J., et al. Biomed. Microdev. (2022) https://doi.org/10.1007/s10544-022-00634-y
-
B. Ungerböck, Charwat, V., Ertl, P., & Mayr, T. Lab on a Chip. (2013) https://doi.org/10.1039/C3LC41315B
-
L. A. Vernetti, Senutovitch, N., Boltz, R., DeBiasio, R., Ying Shun, T., Gough, A., et al. Exp. Biol. Med. (2016) https://doi.org/10.1177/1535370215592121
-
B. Vinci, Duret, C., Klieber, S., Gerbal‐Chaloin, S., Sa‐Cunha, A., Laporte, S., et al. Biotechnol. J. (2011) https://doi.org/10.1002/biot.201000326
-
B. A. Wagner, Venkataraman, S., & Buettner, G. R. Free Rad. Biol. Med. (2011) https://doi.org/10.1016/j.freeradbiomed.2011.05.024
-
A. Wasay, & Sameoto, D. Lab on a Chip. (2015) https://doi.org/10.1039/C5LC00342C
-
S. Ya, Ding, W., Li, S., Du, K., Zhang, Y., Li, C., et al. ACS Appl. Mater. Interf. (2021) https://doi.org/10.1021/acsami.1c00794
-
A. Zanzotto, Szita, N., Boccazzi, P., Lessard, P., Sinskey, A. J., & Jensen, K. F. Biotechnol. Bioeng. (2004) https://doi.org/10.1002/bit.20140
-
B. Zhang, Korolj, A., Lai, B. F. L., & Radisic, M. Nat. Rev. Mater. (2018) https://doi.org/10.1038/s41578-018-0034-7
)
&description=&image=https://drramyarmahdavi.com/wp-content/uploads/2025/04/Design-fabrication-and-characterization-of-a-user-friendly-microfluidic-device-for-studying-liver-zonation-on-chip-ZoC-Research-Open-access-1024x459.jpg)